Dashboard
Your overview: how much came in, how much went out, where it went, and how each business is doing.
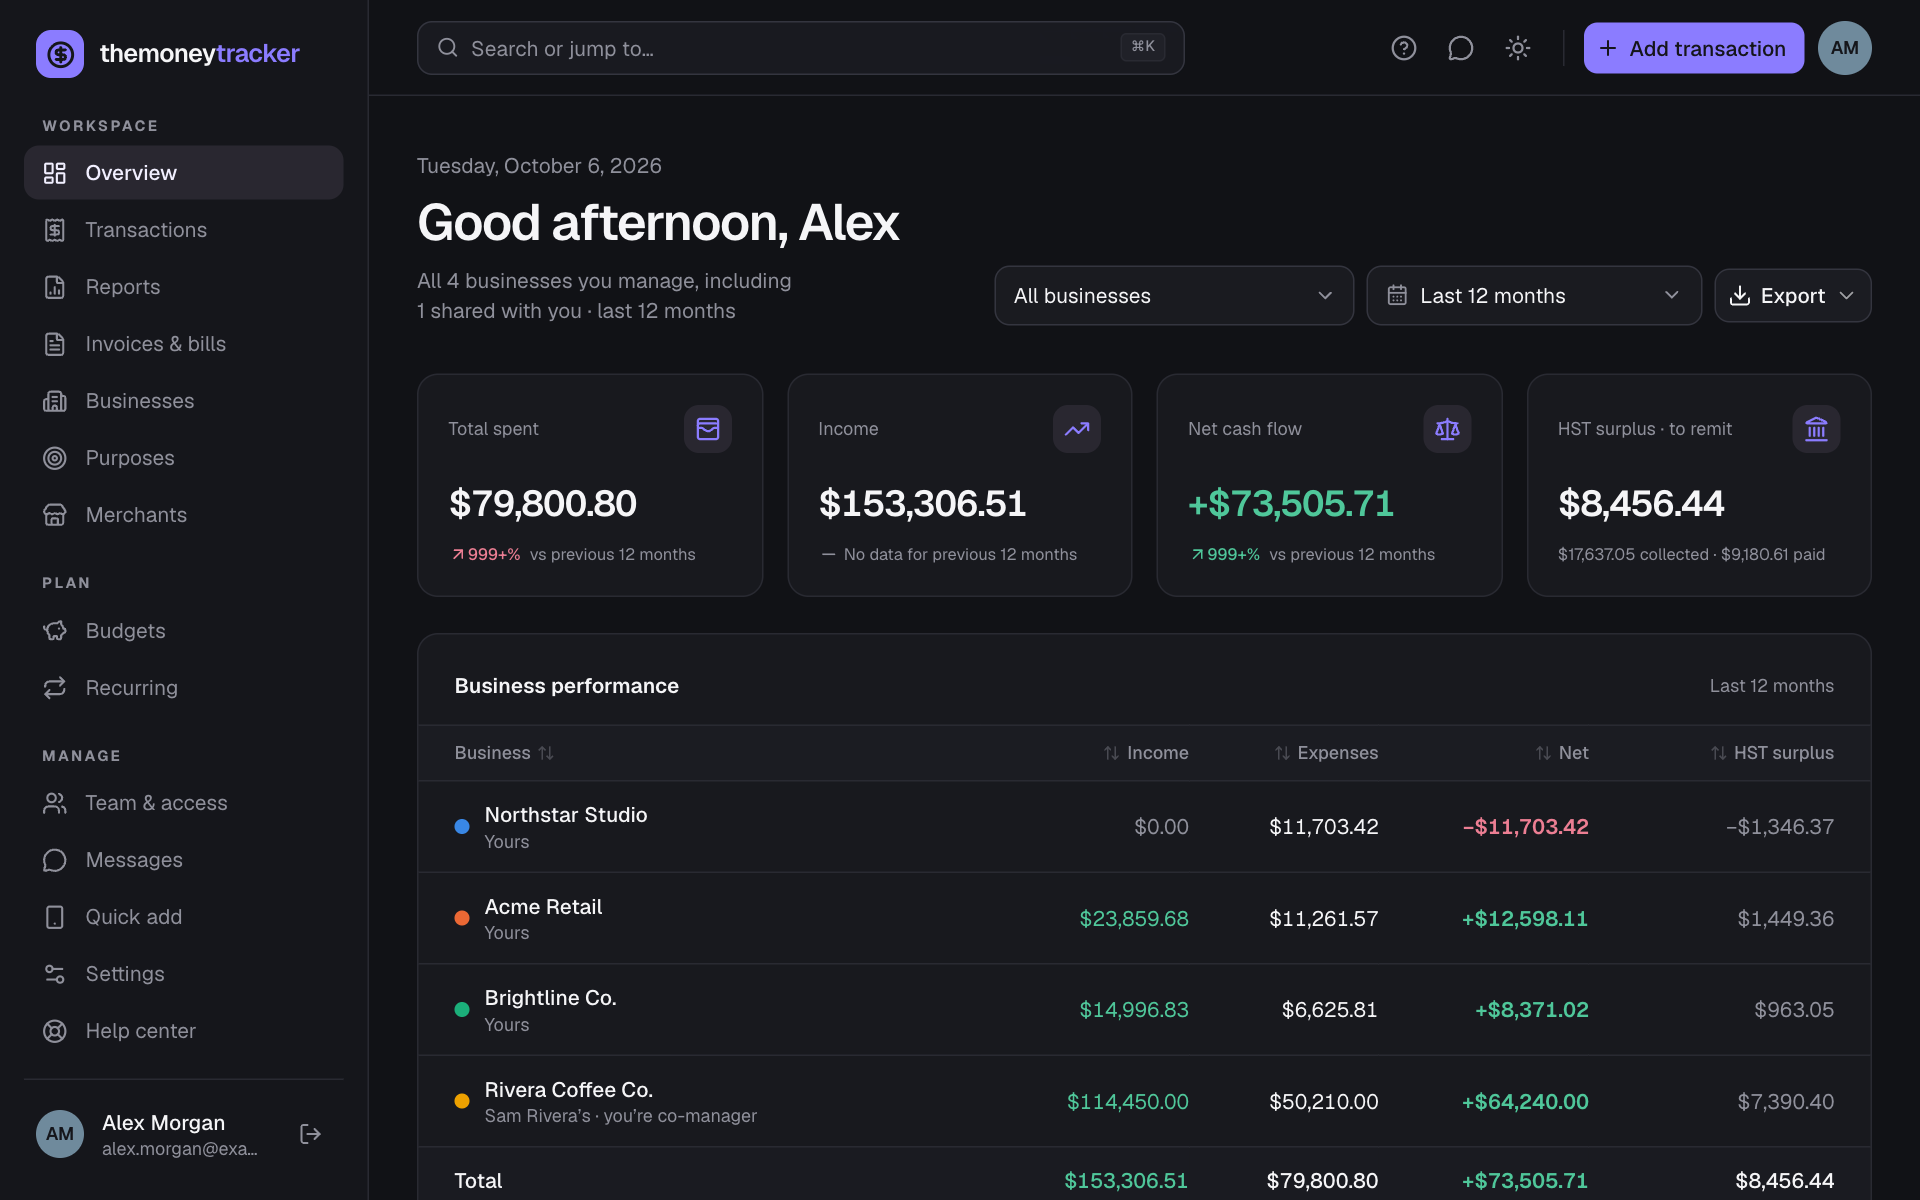
- Business (top right, left of the date range; at the top on a phone): All businesses, one business, or No business (unassigned). Businesses someone shared with you are listed under “Shared by …” with the owner’s first name. Everything on the page follows your choice, and the address keeps it, so you can bookmark a business’s dashboard. Refreshing the page in your browser goes back to All businesses.
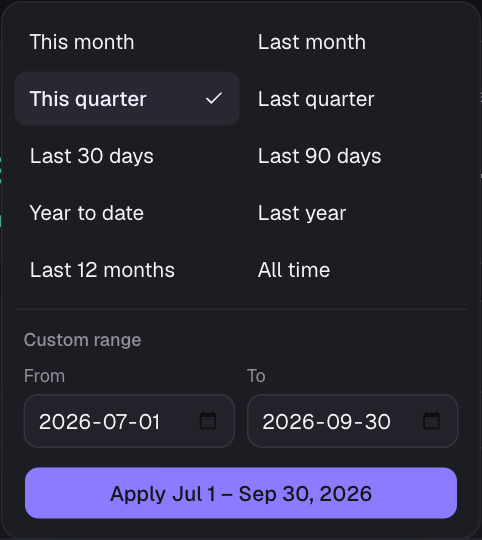
- Date range: This month, Last month, This quarter, Last quarter, Last 30 or 90 days, Year to date, Last year, Last 12 months or All time, or a custom range: pick the From and To dates and choose Apply. A custom range compares with the same number of days just before it.
- Total spent, Income, Net cash flow: each compares with the previous matching period (for example “same point last month”). Green means better, red means worse, so higher spending shows red. Total spent includes fees, and so does net cash flow. Click a card to see those transactions.
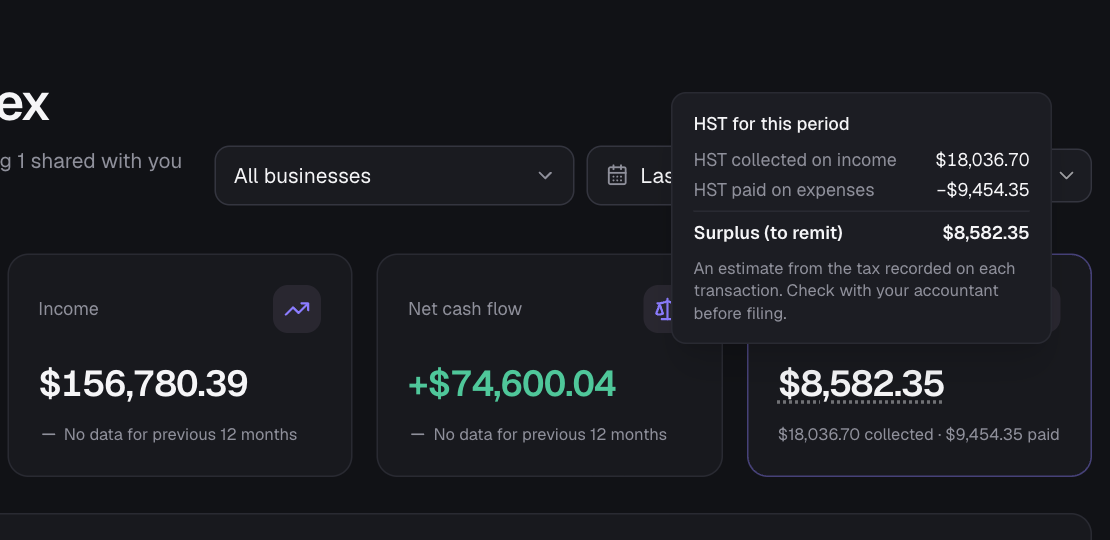
- HST surplus · to remit (or HST deficit · refund): HST collected on income minus HST paid on your expenses and equipment. Click it to jump to the HST panel. It shows once any HST is recorded; otherwise this spot shows your average monthly spend. See Sales tax (HST).
- Export (next to the range): downloads what you’re looking at (the business and period) as CSV or a PDF report.
What counts as income and spending
The Overview counts money the same way as the Reports page, so its figures match the Income Statement and the HST report. Each purpose says how it counts (Purposes, then edit it: In reports, it counts as).
- Left out of income and spending: moving money between your own accounts (paying off a credit card from the bank, say), the owner putting money in or taking it out, loans borrowed or repaid, HST paid to (or refunded by) the government, and equipment. They’re left out of the totals, the charts, spend by business, purpose and payment method, top merchants and the business performance table.
- Fees still count: a fee on a transfer or a loan payment is a cost, so it’s in Total spent.
- HST counts what carries HST of the business’s own: equipment’s HST can be claimed back, so it’s in HST paid even though equipment isn’t spending.
- A line under the cards names the purposes left out in the period. The transactions themselves are always listed on the Transactions page and in every export.
See the split behind any amount
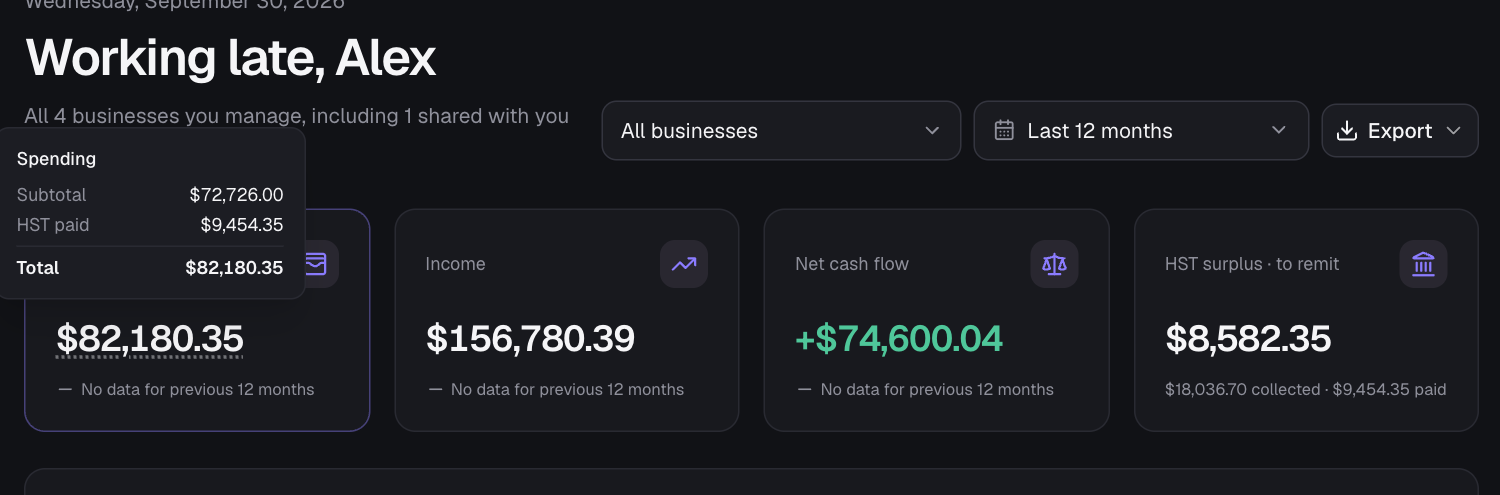
Every money figure can be broken down into subtotal, HST and total (plus fees, when there are any). To keep the page clean the split stays hidden until you hover over an amount (on a phone or tablet, tap it). A dotted underline shows which figure you’re on.
Business performance
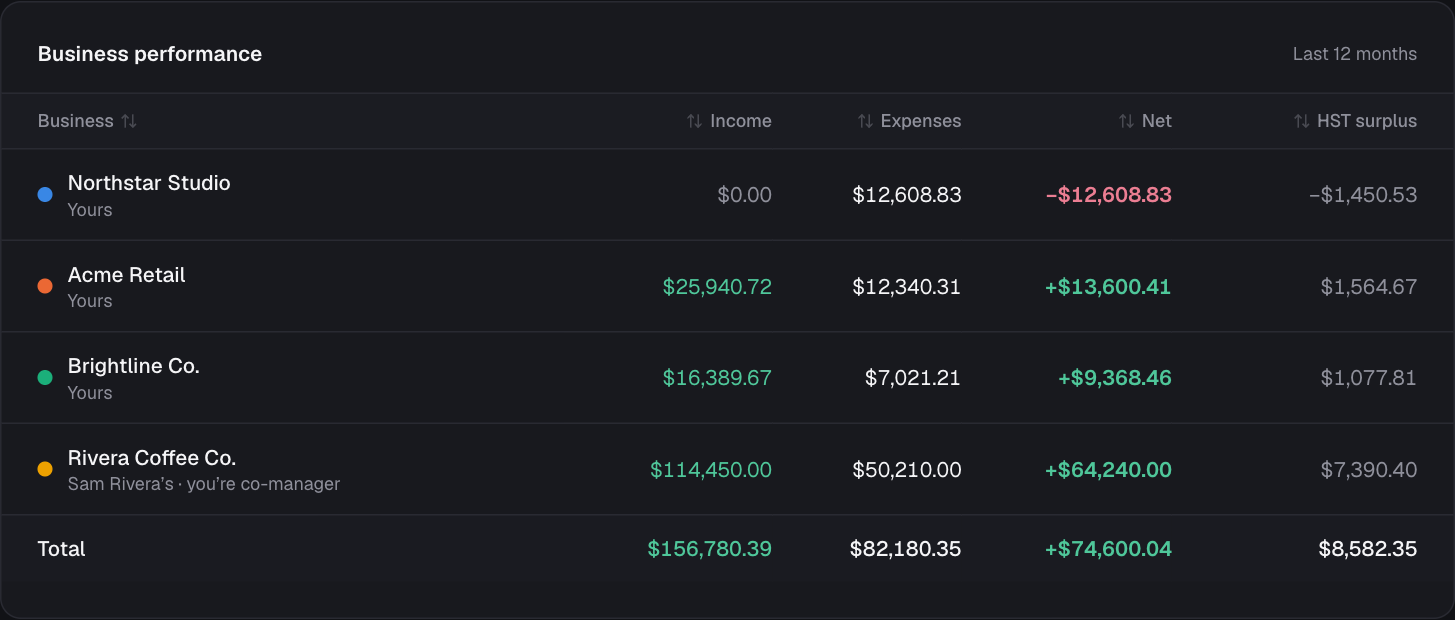
With All businesses selected (and more than one business), a table compares income, expenses (fees included), net and HST surplus (collected minus paid; negative is a deficit) for each business, with a total row. Shared businesses say whose they are and your role. Click a business to open its own dashboard. Click a column heading to sort by it (again to reverse it). On a phone each business is a card with the four figures, and a Sort menu sits above them.
One business at a time
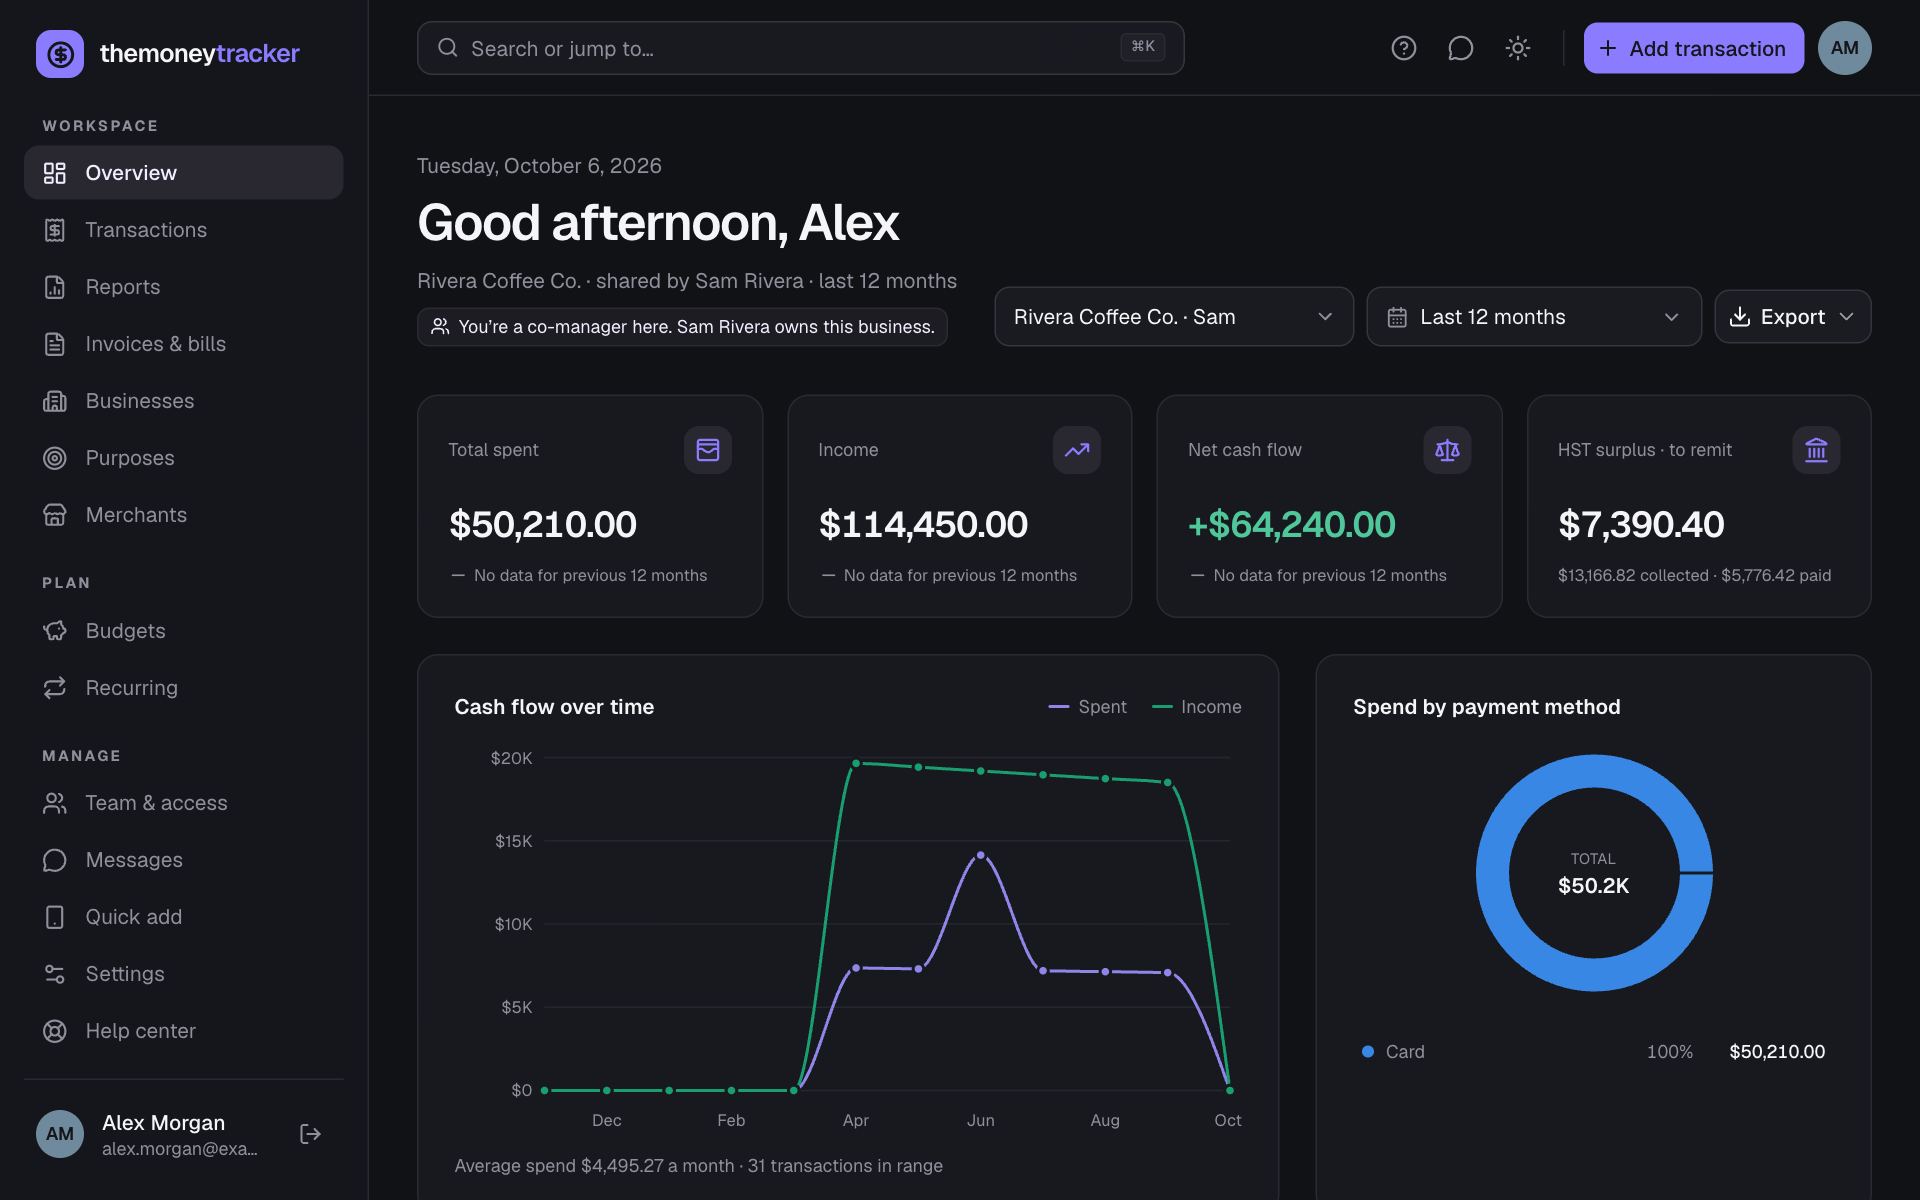
- A shared business shows who owns it and your role right under the greeting.
- Spend by business becomes Spend by payment method, and Top income sources lists who paid that business the most.
- On “All businesses” the budgets panel shows your own books’ budgets. A single business shows its own budgets instead of top merchants, once it has some.
HST
Shows whether you’re running an HST surplus (you collected more than you paid on your expenses, so you’ll likely owe it) or a deficit (you paid more, so you may get a refund) for the business and period you picked.
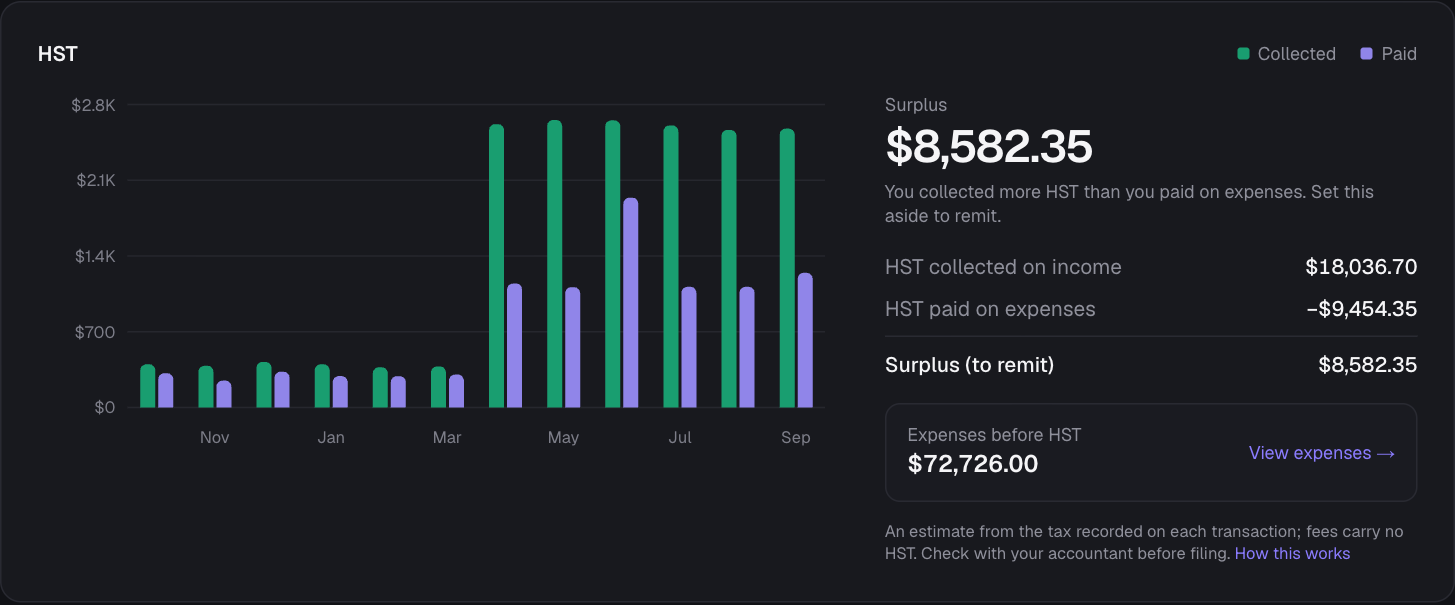
- The chart puts HST collected (green) next to HST paid on expenses (purple) for each day, week or month. Hover a period for both amounts and its surplus or deficit.
- The summary adds them up for the whole range: HST collected on income, HST paid on expenses and equipment, and the surplus or deficit.
- Expenses before HST totals your expenses without their HST. Click it to see them. Fees carry no HST, so they don’t change these figures.
Fees
The Fees section totals the fees in the period (card processing, late payment and bank fees…): how much was taken from income, how much was added to expenses, and each kind of fee with how often it came up. Transactions with fees lists them, and Saved fees opens your list in Settings. See Fees.
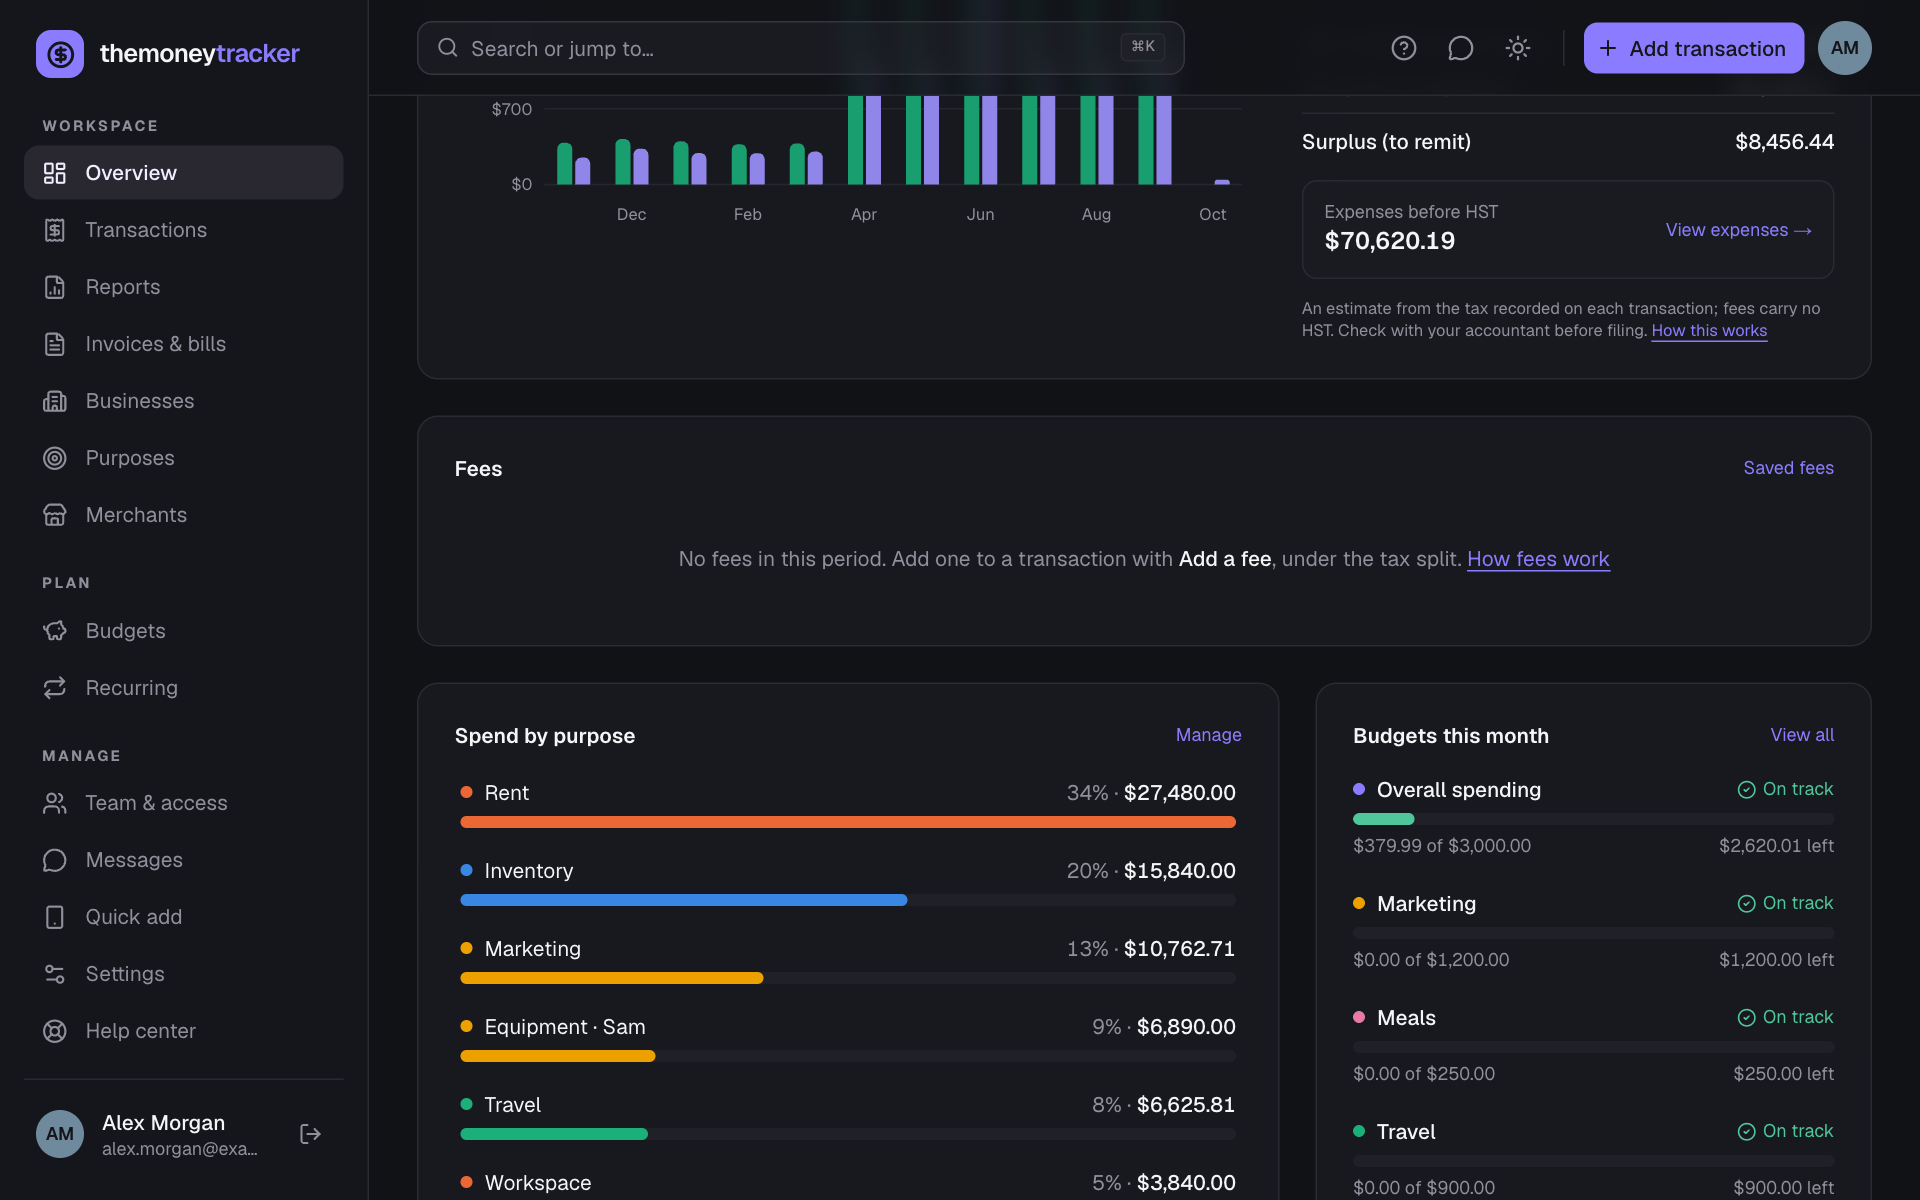
- Cash flow over time: spending and income by day, week or month depending on the range. Hover for exact amounts and the net for that period. Below it: average spend per month and the number of transactions.
- Spend by business / purpose: click a slice, name or row to open those transactions. If two lists share a name (for example your “Travel” and a partner’s “Travel”), the owner’s name is added so they’re never confused.
- Budgets this month, Recent transactions (with who added them) and Top merchants.
Still stuck? See Troubleshooting, or contact the person who runs this site.