Reports: income statement, balance sheet, general ledger and more
Statements and breakdowns from your books, laid out the way you want. Start from a ready-made report, change anything, and download it as a PDF, Excel or CSV file.
Open Reports in the menu (owners, co-managers and accountants). Pick one to start from; each opens with sensible settings you can change:
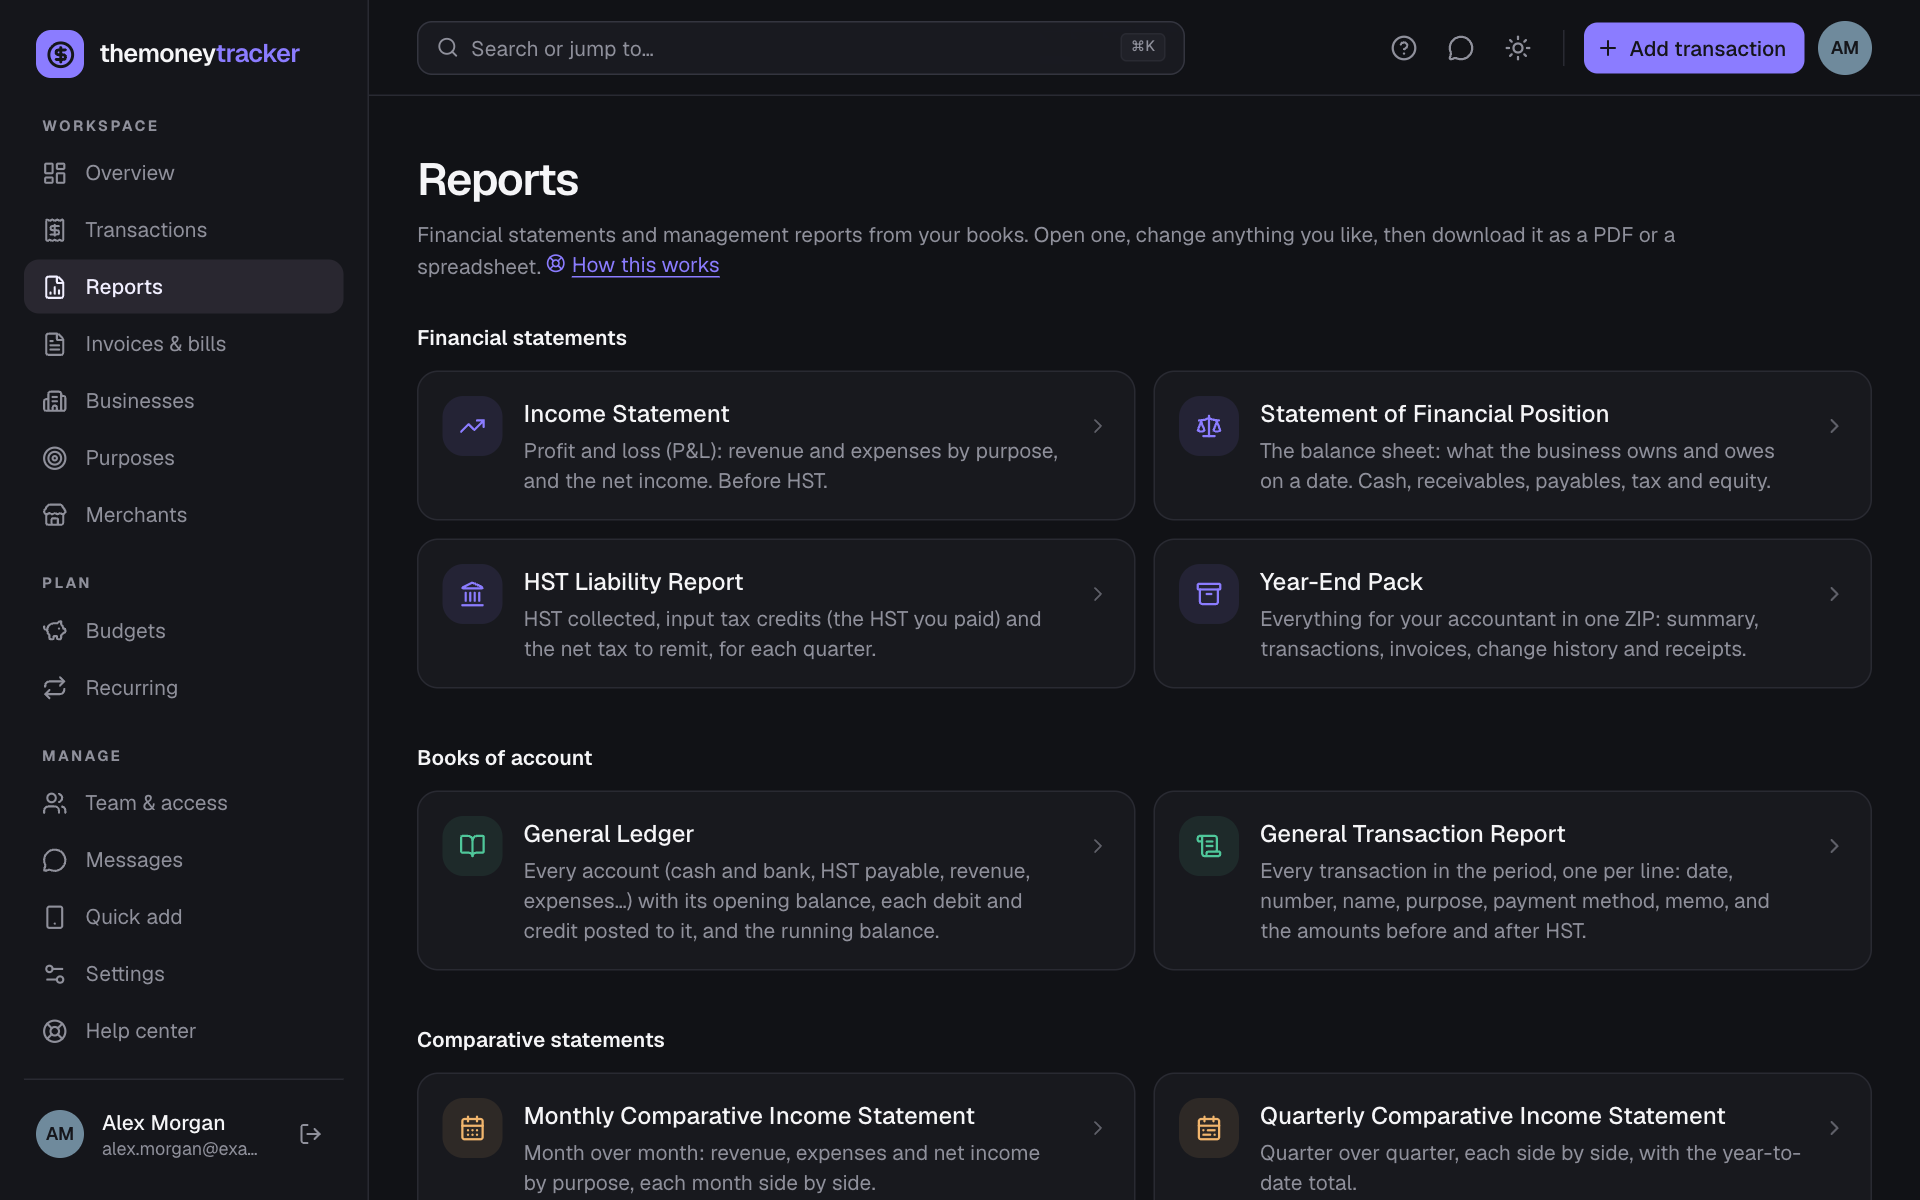
- Financial statements: the Income Statement (profit and loss: revenue and expenses by purpose, and the net income), the Statement of Financial Position (the balance sheet: what the business owns and owes on a date) and the HST Liability Report (HST collected, input tax credits for the HST you paid, and the net tax to remit, for each month, quarter or year, as you file).
- Books of account: the General Ledger (every account with its opening balance, each debit and credit, and the running balance) and the General Transaction Report (every transaction in the period, one per line, with the columns you pick).
- Comparative statements: the Monthly and Quarterly Comparative Income Statements put the periods side by side; the Consolidating Income Statement gives each business a column, with the combined total.
- Management reports break the numbers down: Expense Analysis by Category and Vendor (spending by purpose and merchant), Customer Concentration Report (revenue by customer, with each one’s share), Disbursements by Payment Method (money paid out by card or account) and Transaction Activity by User (what each person recorded).
- Aged Receivables and Payables (A/R and A/P aging) shows who owes what, by how overdue it is.
- The Year-end pack for your accountant is here too.
Change anything
The settings sit beside the report (on a phone or a small window, under Customize), and the report updates as you change them.
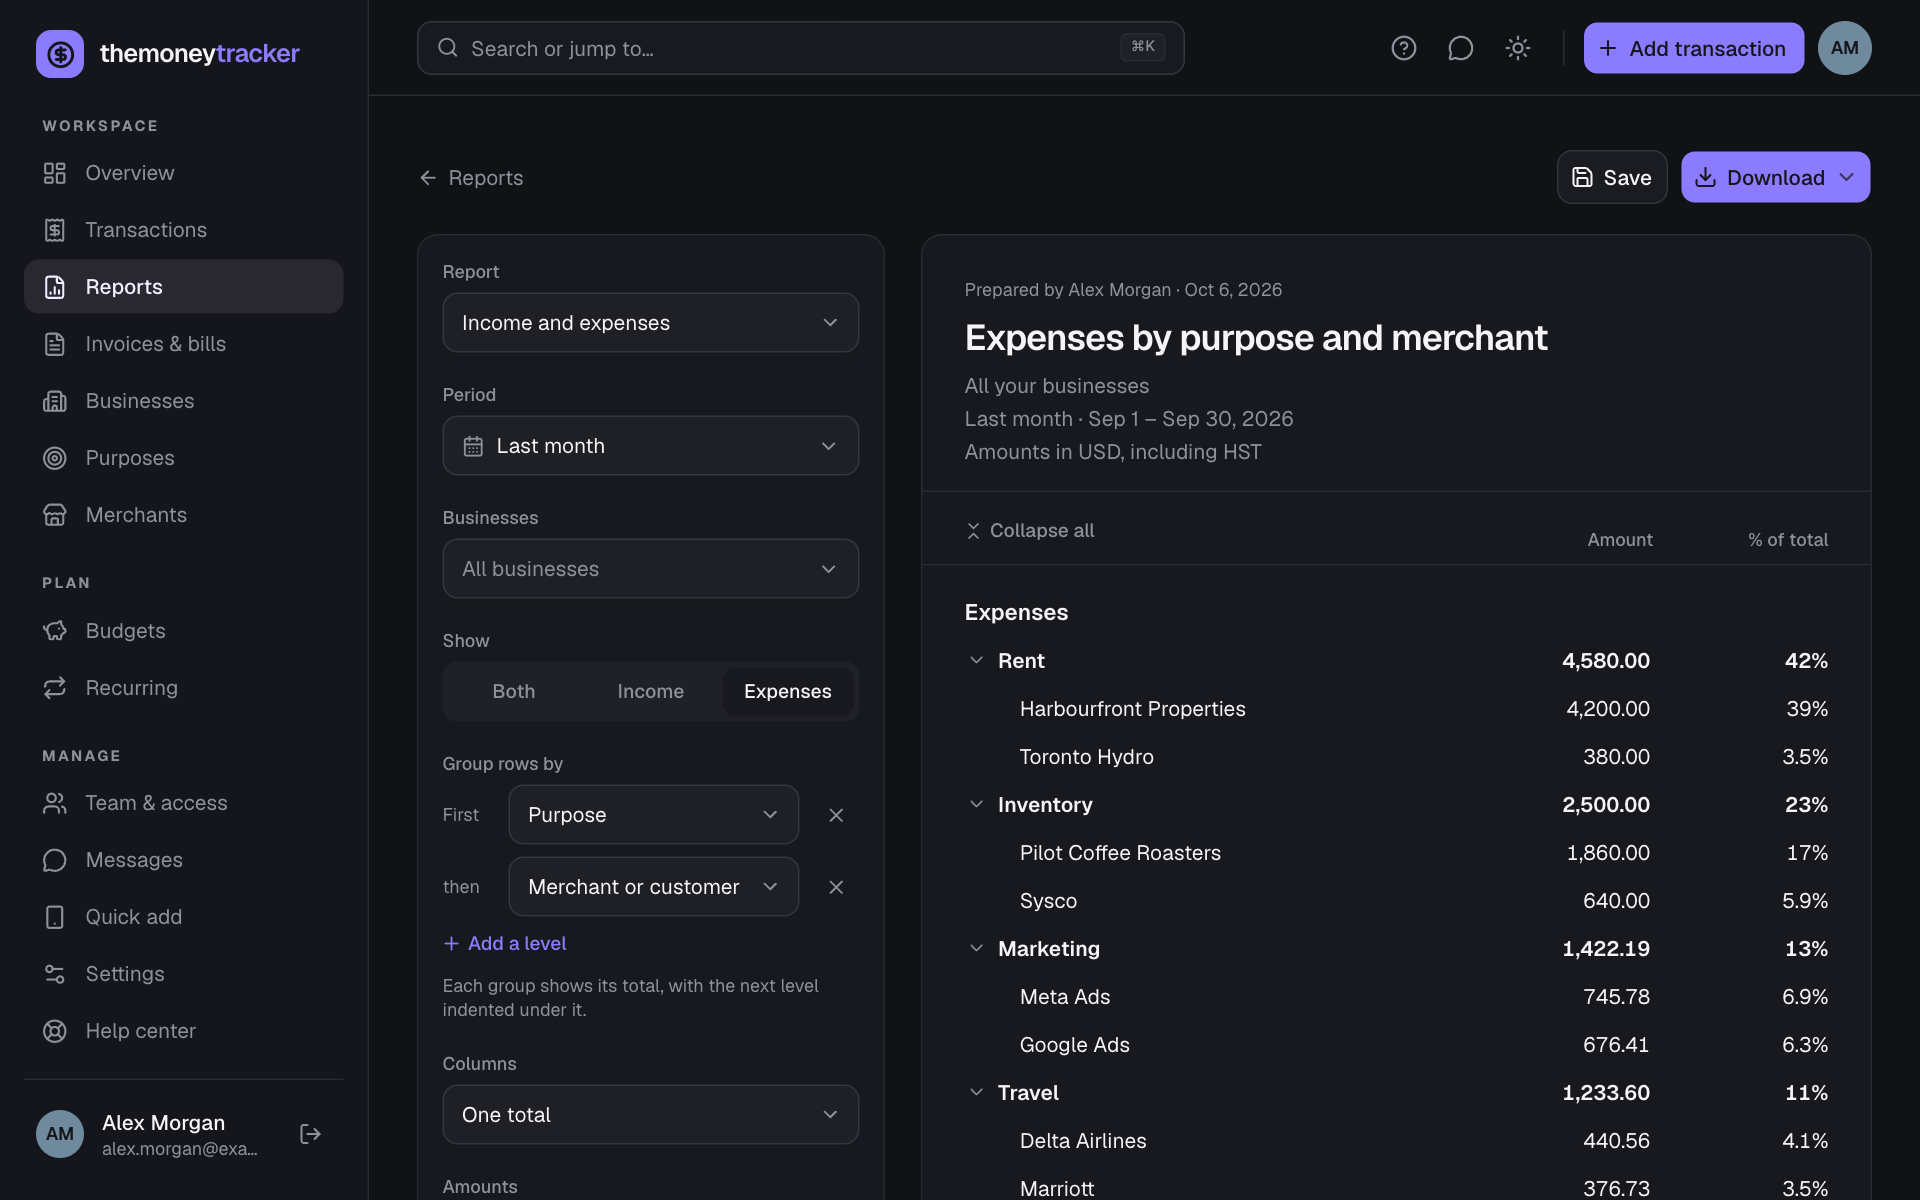
- Period: this month, last quarter, year to date, all time… or your own dates, such as a fiscal year. Businesses: one, a few or all of them. Show: income and expenses, or only one.
- Group rows by: up to three levels from purpose, merchant or customer, business, payment method, who added it, month, quarter and year. Each group shows its total with the next level indented under it, so Purpose, then Merchant or customer lists each purpose’s total with its merchants under it.
- Columns: one total, or a column for each month, quarter, year, business, purpose, payment method or person, with the total (or Year to date) at the end. A month or quarter only partly in the period says which part, such as “to Oct 9”.
- Amounts: before HST, with HST, or only the HST.
- More options: sort groups largest first, smallest first or A to Z; keep the top 5, 10 or 20 in each group (the rest are added up as “Everything else”); add columns for the % of revenue (or of the total), the number of transactions, the monthly average, or the period before with the change; list each transaction under its group; show whole dollars.
- Filters: only some purposes, payment methods or people, or merchants whose name contains a word.
- Title and a note under it (e.g. “For the bank”). Leave the title empty and it describes the report for you. Logo on the PDF: your business’s own logo (from Settings → Invoicing) goes beside The Money Tracker’s, on the right of the title like a letterhead. It’s chosen for you when the report is for one business with a logo; pick another business’s logo, or No logo, any time.
For example, a quarterly report of spending by purpose, with each purpose’s merchants under it:
- 1Open Expense Analysis by Category and Vendor.
- 2Set Period to Last quarter. To see its three months side by side, set Columns to Each month.
- 3Choose Download → PDF, or Save it to open again next quarter.
See what’s behind a number
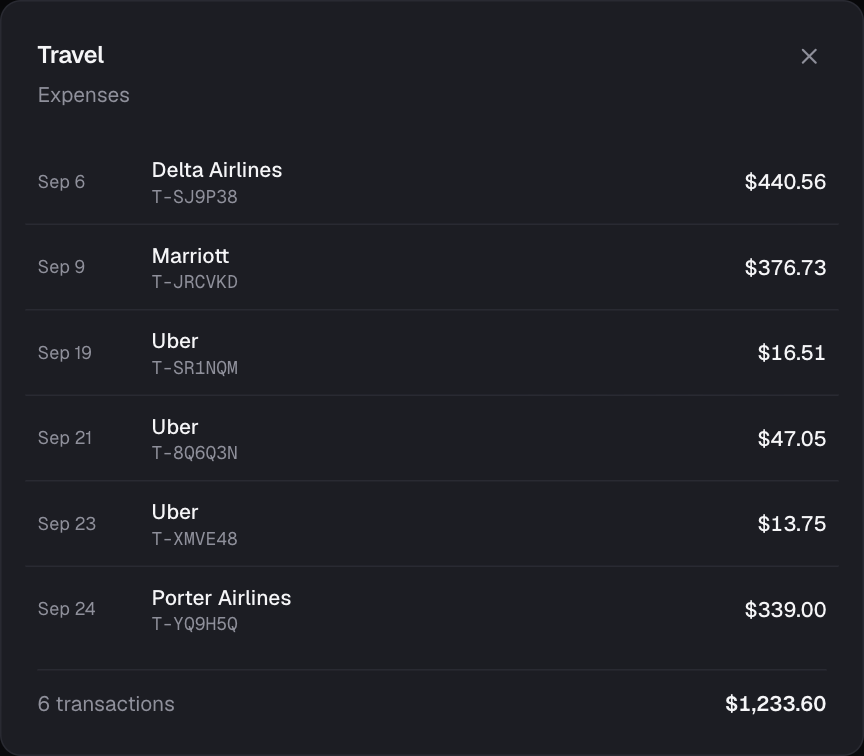
Click any amount to list the transactions that make it up; click one to open it (to change it if you can, otherwise read-only, with its receipt and history). The report updates when you save a change. The arrow beside a group folds it away; Collapse all shows just the totals.
Download
- PDF: laid out like a printed statement, ready to print or send: a line above each total, the bottom line underlined twice, and amounts below zero in brackets, as accountants write them. It turns sideways when there are many columns, and only very wide reports continue on further pages.
- Excel: bold totals, indented groups you can fold with Excel’s + and − buttons, amounts below zero in brackets, and real numbers you can add up.
- CSV: plain numbers for any spreadsheet, with a Level column for the indent.
Downloads always include every line, even ones folded away on screen.
Save a report
Save keeps the settings under a name; they appear at the top of Reports. Each time you open it the numbers are up to date, and a period like “Last quarter” moves on with the calendar. Change a saved report and choose Save changes, or Save as new to keep both. Rename or delete it with ⋯. Saved reports are your own; the address of an open report can be bookmarked or sent to a teammate, who sees it with what they’re allowed to see.
About each report
Every report opens with About this report: what it shows, how its numbers are worked out, how to read them (which amounts are positive and which negative), and what it’s for. Open How to read it for the details.
How money counts: the same in every report
- Purposes that aren’t income or expenses. Each purpose says how it counts (Purposes, then edit it: In reports, it counts as): income or expense, or HST paid to (or refunded by) the government, the owner’s money in or out, a loan borrowed or repaid, equipment that keeps its value, or moving money between your own accounts (paying off a credit card from the bank, say). Only income and expenses are in the profit; the rest show on the balance sheet. Names like “HST remittance”, “Owner draws”, “Loan” or “Transfer” are counted that way to begin with.
- Credit cards. Each payment method is a bank account, cash or debit card (money you have) or a credit card (money you owe): Payment methods, then edit it, Kind of account. Names like Visa, Mastercard or Amex start as credit cards. The balance sheet and general ledger list a card’s balance (purchases less payments) with what the business owes.
- Cash or accrual basis. On the cash basis (the usual one) income and expenses count when they’re paid. On the accrual basis an invoice counts as income when it’s sent and a bill as an expense when it’s received, paid or not, and the payment isn’t counted again. The Income Statement and the balance sheet both offer both, so they always agree: the balance sheet’s net income this year is the Income Statement’s for January 1 to that day.
- Signs. Revenue and expenses are positive in their own sections and the bottom line subtracts them: positive for a profit, negative for a loss (in brackets in PDF and Excel). Tick Expenses as negative amounts (More options) to show expenses with a minus, so each column adds up to the net.
Statement of Financial Position (balance sheet)
- Assets: cash and bank (money in less money out with your bank accounts, cash and debit cards, fees included), money moved between your accounts with only one side recorded, accounts receivable (unpaid invoices, accrual basis) and equipment. Liabilities: credit cards (what’s owed on them), accounts payable (unpaid bills, accrual basis), the HST payable (a refund due if negative) and loans. Equity: the owner’s contributions less drawings, retained earnings (profit from earlier years) and this year’s net income. Both sides always add up to the same total.
- Pick the date (As at) and, to see how things moved, Compare with a month, a quarter or a year earlier.
- Starting balances: add what the business had or owed before its records began, like the money in its bank account or a loan.
- Money that isn’t income or expenses: each purpose’s own setting is used; change one here for this report only.
General Ledger
The ledger an accountant expects, built from your transactions by double entry: each one is posted to the account of its payment method (a bank account, or a credit card with the liabilities) and to its purpose’s account, with the HST that counts in HST payable and any fees in Fees. So a $113 purchase on a Visa is a $100 debit to its purpose, a $13 debit to HST payable and a $113 credit to the Visa, and total debits always equal total credits. Each kind of account has its total, and at the bottom Revenue for the period, Less expenses for the period and the Net income (loss) show the profit worked out from it, the same as the Income Statement for those dates.
- Accounts come under Assets, Liabilities, Equity, Revenue and Expenses. Each starts with its opening balance (everything before the period; revenue and expense accounts from January 1, with earlier years’ profit in Retained earnings), then lists each posting with its type, ID, name, memo, the accounts on the other side (Split), the debit or credit and the running balance. Click a line to open the transaction.
- Balances are on each account’s usual side: debit for assets and expenses, credit for liabilities, equity and revenue.
- Accounts narrows it to some kinds (only revenue and expenses, say). Untick List each debit and credit for one line per account (opening balance, debits, credits and closing balance), and An account for each payment method for one “Cash and bank”.
- As on the balance sheet, Money that isn’t income or expenses says which purposes hold HST payments, the owner’s money, loans or equipment, so they post to those accounts instead of revenue or expenses.
General Transaction Report
Every transaction in the period, one per line, oldest first (or newest, or largest). Choose the Columns: type, ID, name, business, purpose, payment method, who added it, memo, tags, the amount in the currency it was paid in, subtotal, HST, fees and total. With income and expenses together, money out is negative so the totals at the end are what’s left; show only one to see positive amounts. Group by purpose, payment method, month or anything else for a subtotal under each heading (the Transaction Detail by Purpose and so on), and narrow it with Filters. A report lists up to 5,000 transactions; for more, pick a shorter period.
Aged Receivables and Payables (unpaid invoices and bills)
What customers owe you and what you owe suppliers on a date, by customer or supplier, in columns for not due yet, 1–30, 31–60, 61–90 and over 90 days late. Tick List each invoice and bill to see them one by one; click one to open it.
Questions
›Why is the cash on my balance sheet negative?
Cash is everything recorded as coming in minus everything going out. If you record your expenses but not the money that pays for them (sales, or the owner’s deposits), it goes below zero. Record that money, or add a starting balance for what the business had.
›A report says it has too many columns.
A column for each month over many years is too wide to read. Choose the suggested Each quarter or Each year, or a shorter period.
›Can I get a report by email every month?
Settings → Emails sends a summary report daily, weekly, monthly, quarterly or yearly. For a report laid out your way, save it here and open it when you need it.
Still stuck? See Troubleshooting, or contact the person who runs this site.